Fig. 2.
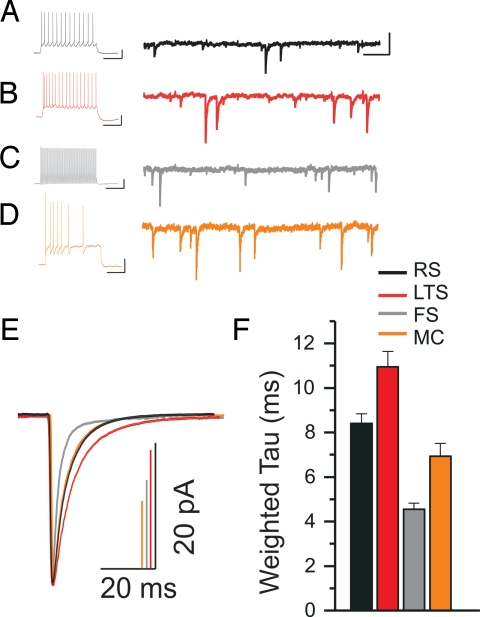
Layer 4 cortical neurons display unique inhibitory postsynaptic currents (IPSC) decay kinetics. (A) Current-clamp recording showing firing behavior of a regular-spiking (RS) cell from a depolarizing current pulse. To the right is the voltage-clamp recording of the cell representing a continuous raw trace of IPSCs spanning 2 s. (B–D) Current-clamp and voltage-clamp recordings for: a low-threshold-spiking (LTS) cell, a fast-spiking (FS) cell, and a burst accommodating Martinotti cell (MC), respectively. [Scale bars: for the current-clamp traces, 20 mV, 200 ms; for the voltage-clamp traces, 50 pA, 200 ms.] (E) Isolated IPSCs from cells in A–D (in matching colors to the recordings above) were collected and averaged into a single trace (RS, n = 188; LTS, n = 173; FS, n = 161; MC, n = 89). Amplitudes of all averaged IPSCs were scaled to illustrate decay differences. All averaged IPSC traces were fit with a double-exponential decay function, and then weighted time constant (τd,w) values were derived from these fits. (F) Mean values of τd,w from pooled data of all cells in each neuron category.

