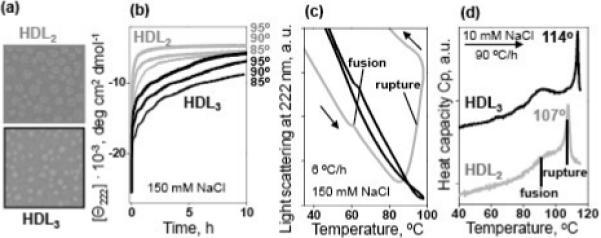
Figure 2.

Comparison of thermal stability of human plasma HDL2 and HDL3.
(a) Negative staining electron micrographs of HDL2 and HDL3 used in our stability studies.
(b) Kinetic data of HDL2 (gray) and HDL3 (black) recorded in T-jumps from 25 to 85−95 °C (final temperatures are indicated on the lines); the time course of the protein unfolding was monitored by CD at 222 nm. Sample conditions are 33 μg/mL protein in buffer B (10 mM Na phosphate, pH 7.6, 1 mM EDTA, 0.05% NaN3, 150 mM NaCl).
(c) Melting data recorded by 90° light scattering to monitor changes in the particle size upon HDL heating and cooling at a constant rate of 6 °C/h. The directions of the temperature changes are shown by arrows; the data are shifted along the y-axis to avoid overlap. Sample conditions and color-coding are as in panel a. Negative slopes in the light scattering data result from an optical artifact of the CD instrument and from the temperature dependence of the refractive index.45 HDL fusion (that causes a small increase in the particle size) and rupture (that causes lipid coalescence into large droplets leading to a large increase in the light scattering29) are indicated.
(d) Excess heat capacity Cp(T) recorded by DSC upon HDL heating at a rate of 90 °C/h. Sample conditions are 2.5 mg/mL protein in buffer A (10 mM Na phosphate, pH 7.6, 1 mM EDTA, 0.05% NaN3) containing 10 mM NaCl. The data are shifted along the Y-axis to avoid overlap; the distance between the ticks is 1 kcal/mol·K. HDL fusion and rupture are indicated.
