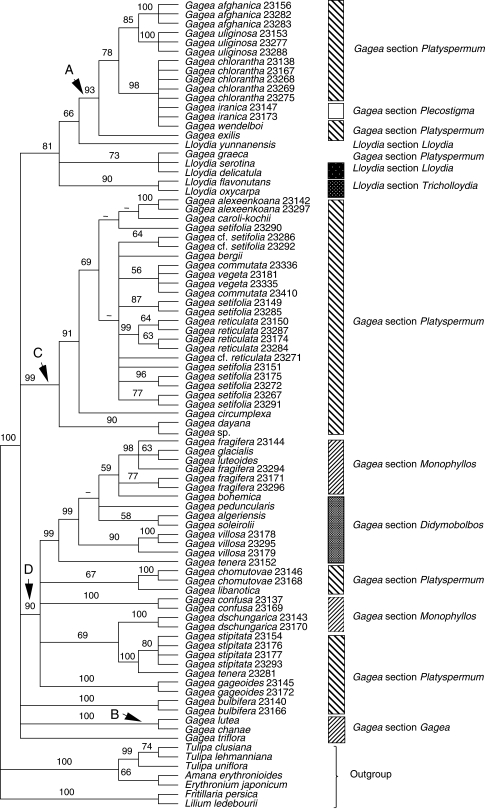
Fig. 2.
Bootstrap percentages (≥50) are indicated above branches on the strict consensus tree of 7620 trees obtained from analysis of the combined plastid data matrix (rpl16 intron, trnL intron, trnL-F spacer, matK and the psbA-trnH spacer; sequences from GenBank are excluded). Branches with a hyphen have BP < 50. Pascher's classification (1904, 1907) is shown next to the tree.

