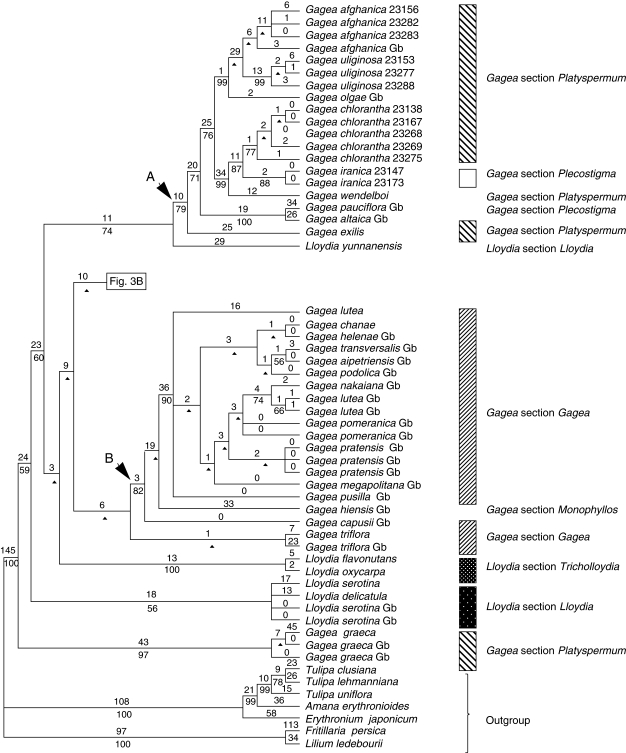
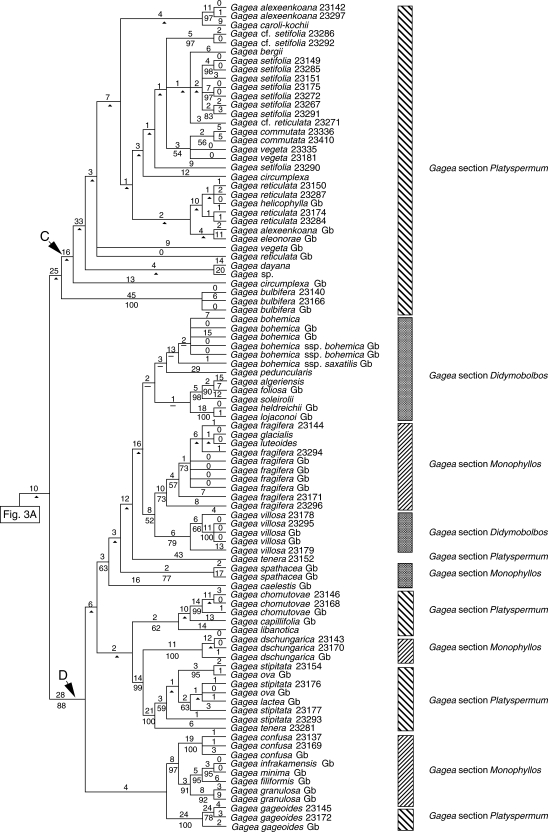
Fig. 3.
One of the most-parsimonious trees, randomly selected from 6430 trees, obtained from analysis of the combined data matrix (nuclear ribosomal ITS, and plastid rpl16 intron, trnL intron, trnL-F spacer, matK and the psbA-trnH spacer; sequences from GenBank are included). Tree length = 2388, CI = 0·62, RI = 0·90. Branch lengths (DELTRAN optimization) are indicated above branches and bootstrap percentages below. An arrowhead indicates nodes collapsing in the strict consensus of all most-parsimonious trees. Branches with a hyphen have BP < 50. Gb after the species names indicates those taken from GenBank. For cases in which more than one accession of a species were analysed, numbers after the species names are RBG, Kew, DNA Bank accession numbers (see Appendix).


