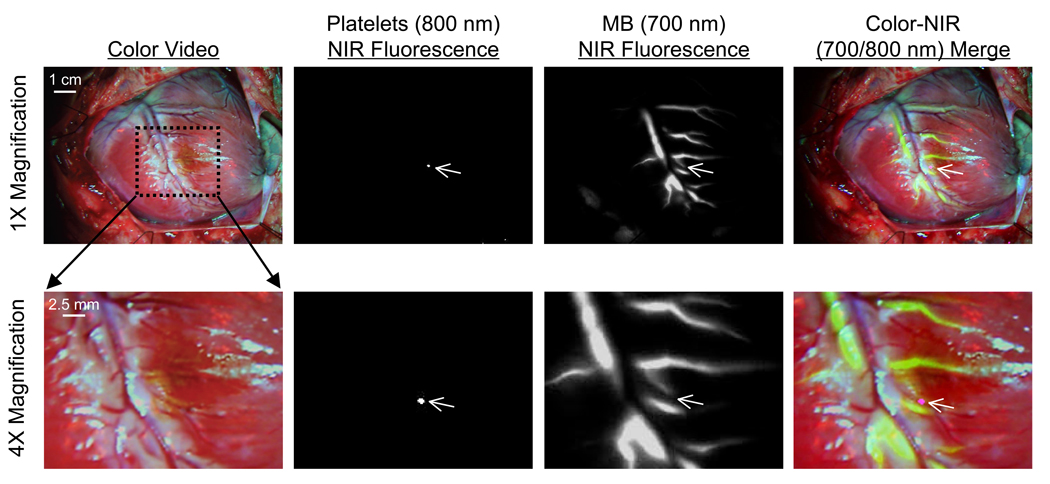
Figure 5. Real-Time, Simultaneous Assessment of Acute Coronary Artery Thrombi and Coronary Artery Patency.
A coronary artery thrombus was induced in a diagonal branch of the LAD by treatment with FeCl3 (center of dotted rectangle). Thrombus size and location was quantified by intravenous injection of IR-786-labeled autologous platelets (800 nm fluorescence; pseudo-colored in magenta in merged image). Coronary artery patency (and tissue perfusion) was quantified by intravenous bolus injection of 1 mg/kg MB (700 nm fluorescence; pseudo-colored in lime-green in merged image). Shown are color video (1st column), 800 nm NIR fluorescence (2nd column), 700 nm NIR fluorescence (3rd column) and a pseudo-colored merge of the three (4th column) at 12 sec post MB injection. The area within the dotted rectangle in the top row is shown magnified 4-fold in the bottom row. NIR fluorescence images were acquired with a 100 msec exposure time and are displayed with identical normalizations. Images are representative of N = 4 independent animals.

