Figure 2.

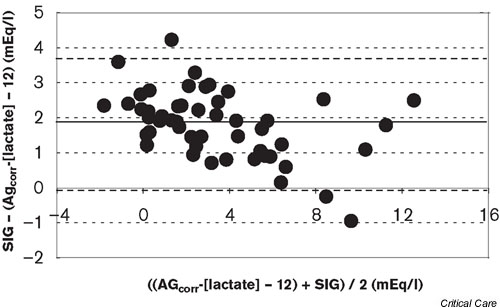
Bland-Altman analysis of the albumin-corrected anion gap minus lactate (AGcorr) and the strong ion gap (SIG) (bias, 1.81 and precision, 0.96).

Bland-Altman analysis of the albumin-corrected anion gap minus lactate (AGcorr) and the strong ion gap (SIG) (bias, 1.81 and precision, 0.96).