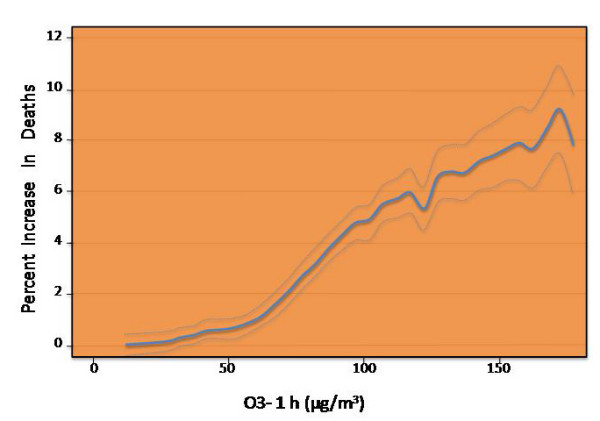
Figure 4.

O3 and mortality. Dose-response of ozone 1 hour (average of lags 0 and 1) and daily number of deaths during the summer season) redrawn from [27].

O3 and mortality. Dose-response of ozone 1 hour (average of lags 0 and 1) and daily number of deaths during the summer season) redrawn from [27].