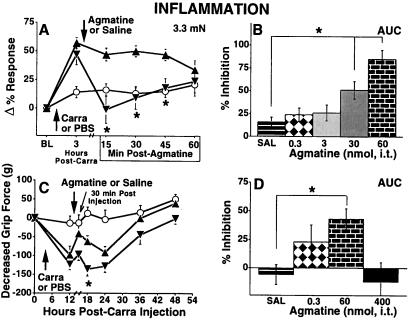
Figure 1.
Inflammation. (A and C) Time course of AG or SAL treatment (i.t.) after inflammation-induced hyperalgesia. The duration of hypersensitivity was compared among CARRA + SAL, PBS + SAL, and CARRA + AG. (B and D) Area under the curve (AUC; average across time) showing dose-related inhibition of hyperalgesia by AG. Included data coincide with times when preliminary studies had revealed significant differences between CARRA- and PBS-treated groups. The percent inhibition was calculated from the equation [(Control − Experimental)/Control] × 100%, and * indicates a statistically significant difference (ANOVA with Bonferroni) between the SAL-injected control and AG-treated groups (doses at and below the most effective inhibitory dose). These experiments were replicated and produced comparable results. (A) Mechanical hyperalgesia. Three hours after CARRA injection into the hindpaw, mice showed increased responses (▴) compared with PBS-injected controls (figchr;○) (P ≤ 0.001, Student's t test). AG (60 nmol, i.t.) (figchr;▾) injected 3 h after CARRA reduced hyperalgesia. The * indicates a statistically significant difference (ANOVA-repeated measures with Bonferroni). (B) AUC (15, 30, and 45 min) after AG injection. (C) Muscle hyperalgesia. Twelve hours after CARRA injection into the triceps, rats showed decreased grip force (▾) compared with PBS-injected controls (○) (P ≤ 0.001, Student's t test); AG (60 nmol, i.t.) (▴) injected 12.5 h after CARRA reduced hyperalgesia. (D) AUC (12.5, 18, and 24 h after CARRA injection).

