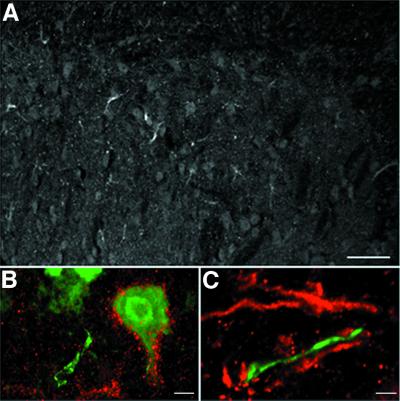
Figure 7.
AG-LI in mouse spinal cord. Single, 14-μm cross-sections were single- or double-labeled by using antisera to NeuN (green) or DβH (green, noradrenergic) and AG (red). Double-labeled micrographs represent projected images from multiple optical sections (o.s.) acquired at 1-μm intervals using a ×60 objective and confocal zoom. (A) AG-LI in dorsal horn is in a few fibers; the midline is on the left. (Bar = 200 μm.) (B) Area dorsolateral to central canal: AG and NeuN (5 o.s.). (Bar = 5 μm.) (C) Lumbar dorsal horn: AG and DβH (6 o.s.). (Bar = 5 μm.)

