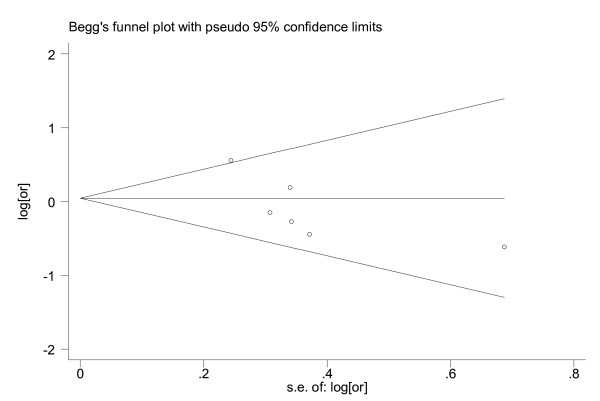
Figure 2.
Funnel plot for publication bias in the analysis of IGF-I and lung cancer. Each circle indicates the logarithm of the odds ratio of lung cancer comparing the subjects in the highest category with the lowest (vertical axis) and the standard error of logarithm of odds ratio in each study. The line in the centre indicates the summary diagnostic odds ratio.

