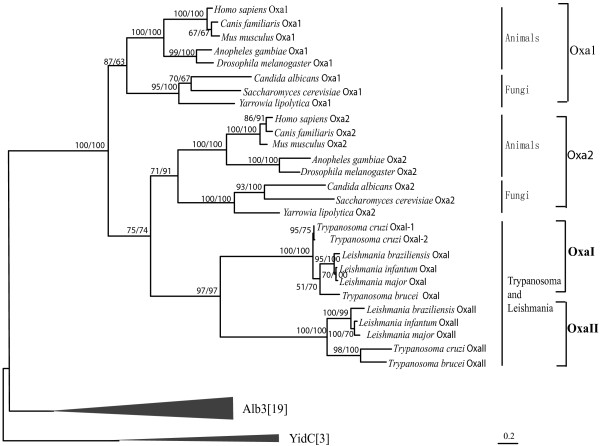
Figure 3.
Phylogeny of Oxa subfamily. The tree is based on alignment of the full protein sequences with Alb3 and YidC as outgroups. It mainly shows the phylogeny of Trypanosoma and Leishmania Oxa. NJ and ML methods were both used, and percent bootstrap values are given as in Figure 2. Numbers of species for the condensed branches are shown in brackets.

