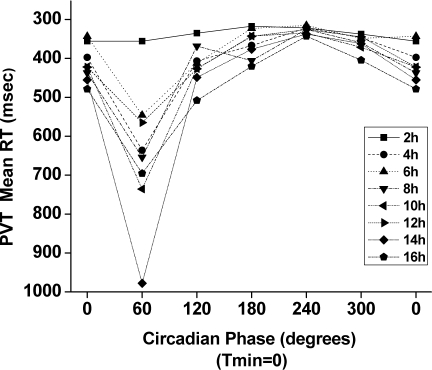
Figure 4.
Interaction of time awake with circadian phase on mean reaction time (RT). In this plot, Psychomotor Vigilance Test (PVT) mean RT data from each 2-hour time awake bin are shown single plotted with respect to the circadian phase of the core body temperature rhythm (with the fitted temperature nadir (Tmin) = 0°). Note that the y axis is inverted to show that better performance is up and worse performance is down.

