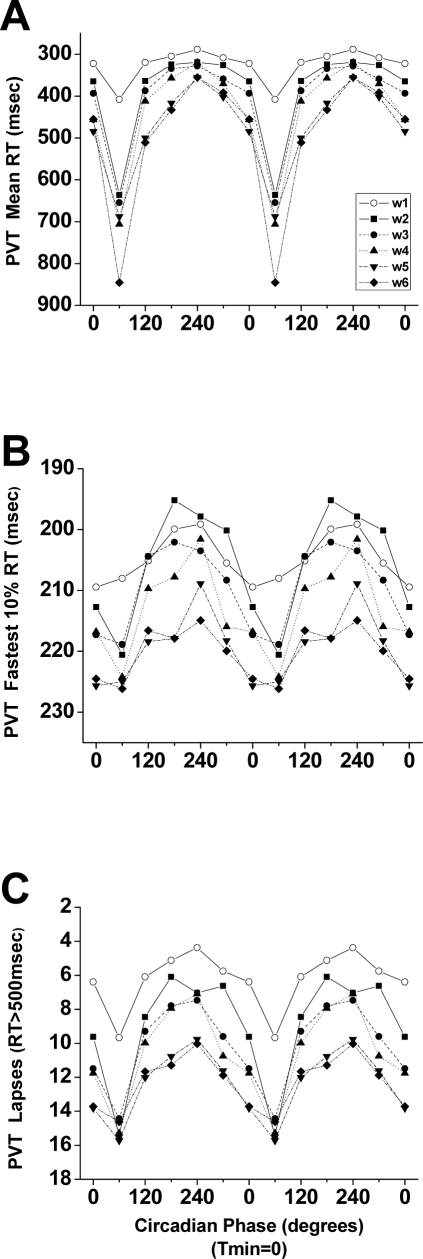
Figure 5.
Interaction of forced desynchrony week with circadian phase on Psychomotor Vigilance Test (PVT) reaction time (RT) data. PVT data from each forced desynchrony week are shown double plotted with respect to the circadian phase of the core body temperature rhythm (with the fitted temperature nadir (Tmin) = 0°). Panel A: mean RT. Panel B: fastest 10% RT. Panel C: lapses (RT > 500 milliseconds). Note that the y axes are inverted to show that better performance is up and worse performance is down.

