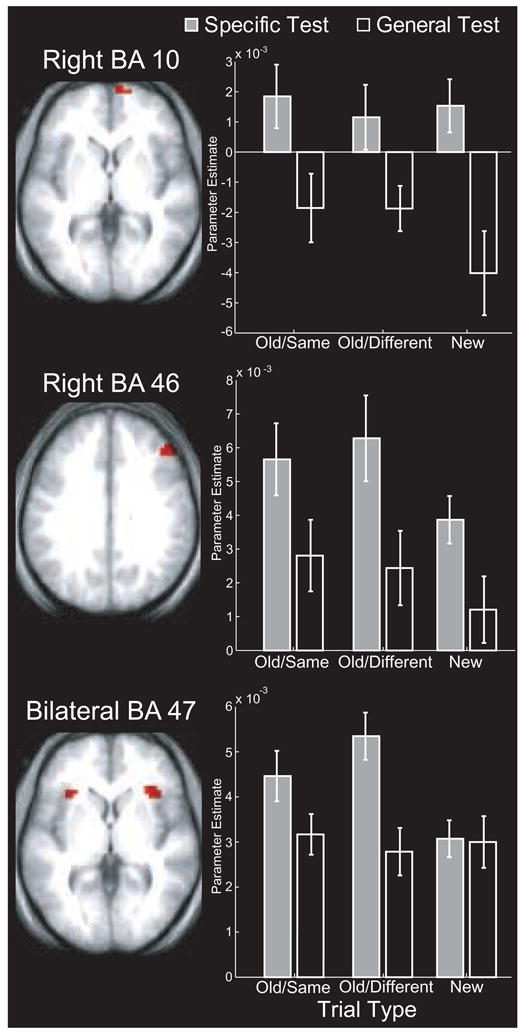
Figure 2.

Patterns of activation in right anterior, right dorsolateral, and bilateral ventrolateral PFC. Mean parameter estimates from each ROI during the specific (gray bars) and general (open bars) tests are separately plotted for old/same, old/different, and new items. Error bars depict the standard error of the mean.
