Figure 3.
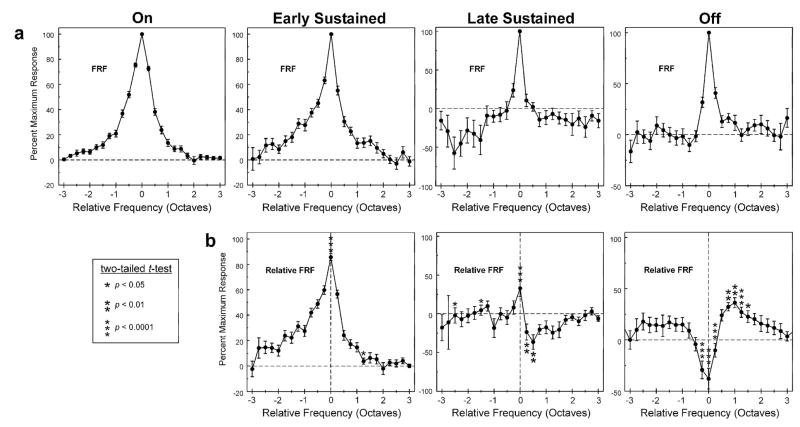
Mean FRF for each of the time windows examined in the study. a, Mean of FRFs expressed relative to the frequency of the peak of the FRF for each of the time windows examined in the study, as indicated above each column. Means represent the average of FRFs across A1 sites (N=67). Error bars represent +/−SEM. Bin width = 0.25 octave. b, Mean of FRFs expressed relative to the frequency of the peak of the FRF for the “on” time window for each of the time windows examined in the study (denoted as “Relative FRF”). Statistically significant differences (p <.05) between means of relative FRFs in b and corresponding means of FRFs in a are indicated by the asterisks. Significant differences represent a change in the FRF for the specified time window compared to the FRF for the “on” time window. Note the trough in the relative FRF for the “off” time window at a frequency corresponding to the peak of the FRF for the “on” time window. See text for details.

