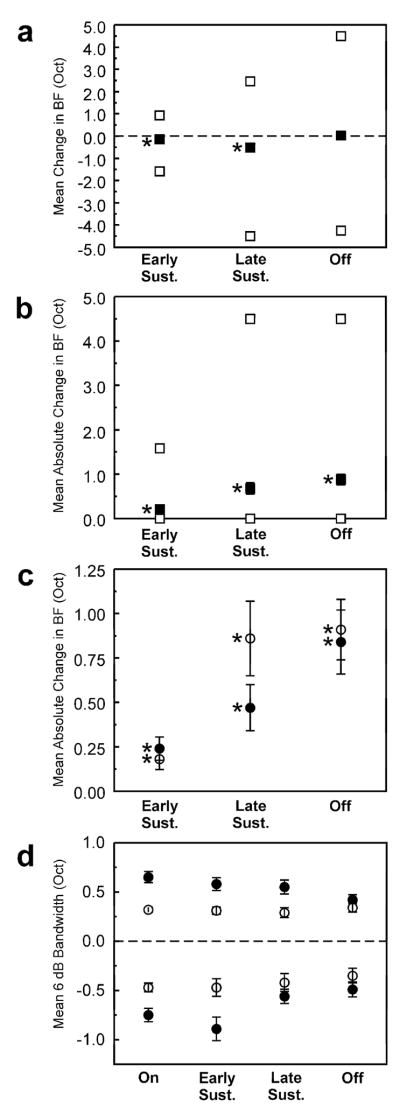
Figure 6.
a, Mean change in BF (in octaves) relative to the BF for the “on” time window for each of the time windows examined (black symbols). Error bars represent +/− SEM (some of which are too small to be discernable in the figure). White squares above and below the black symbols represent the upper and lower range of variation in BF, respectively. Mean change in BF is statistically significant (one-sample t-test; p <.0001) for “early sustained” and “late sustained” time windows (as indicated by asterisks). b, Mean absolute change in BF (i.e., ignoring sign). Same conventions as in a. Mean absolute change in BF is statistically significant (one-sample t-test; p <.0001) for all time windows examined. c, Mean absolute change in BF for sites with a low (black symbols) and with a high (white symbols) “on” BF. Mean change in BF is statistically significant for all time windows and for both sites with a low and with a high “on” BF (one-sample t-test; p <.0005). d, Mean 6-dB bandwidth of the FRF for each of the time windows examined. Sites with “on” BFs above and below 2 kHz are represented by the white and black symbols, respectively. Mean upper and lower 6-dB bandwidths are represented by symbols above and below zero, respectively. Error bars represent +/− SEM. Variations in bandwidth across time windows are statistically significant only for lower 6-dB bandwidths at sites with a low “on” BF (one-way ANOVA, p <.01). Mean lower and upper bandwidths are significantly narrower at sites with an “on” BF above 2 kHz (two-way ANOVA, p <.0001).

