Figure 4.

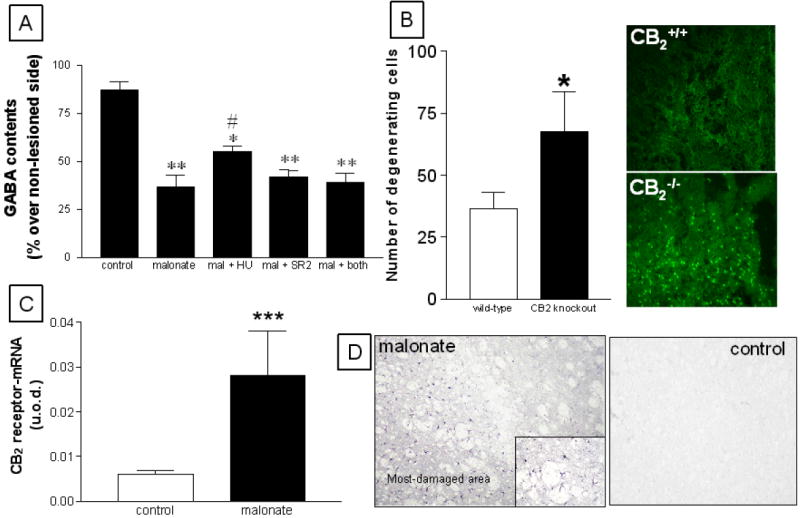
Panel A: GABA contents in the striatum of rats subjected to unilateral injections of malonate and treated with HU-308, SR144528, or both, and their respective controls. Details in the text. Values correspond to % of the lesioned side over the non-lesioned one for each subject, and are presented as means ± SEM of 5-7 subjects per group. Data were assessed by one-way analysis of variance followed by the Student-Newman-Keuls test (*p<0.05, **p<0.005 vs the controls; #p<0.05 vs the other malonate groups). Panel B: Number of degenerating cells measured in FluoroJade B stained-sections (representative images are 20x) corresponding to the striatum of CB2+/+ and CB2-/- mice subjected to unilateral injections of malonate. Details in the text. Values are means ± SEM of 5 subjects per group. Data were assessed by the Student’s t-test (*p<0.005 vs the wild-type group). Panel C: mRNA levels for CB2 receptors (measured by RT-PCR) in the striatum of rats subjected to unilateral injections of malonate and their respective controls. Details in the text. Values are means ± SEM of 5-7 subjects per group. Data were assessed by the Student’s t-test (***p<0.005 vs the controls). Panel D: Immunostaining corresponding to CB2 receptors in the striatum of rats subjected to unilateral injections of malonate and their respective controls. Note the glial-like appearance of CB2 positive cells in the inset in the panel corresponding to malonate-lesioned animals, as well as the spatial segregation within the lesioned striatum. Magnification was 20x.
