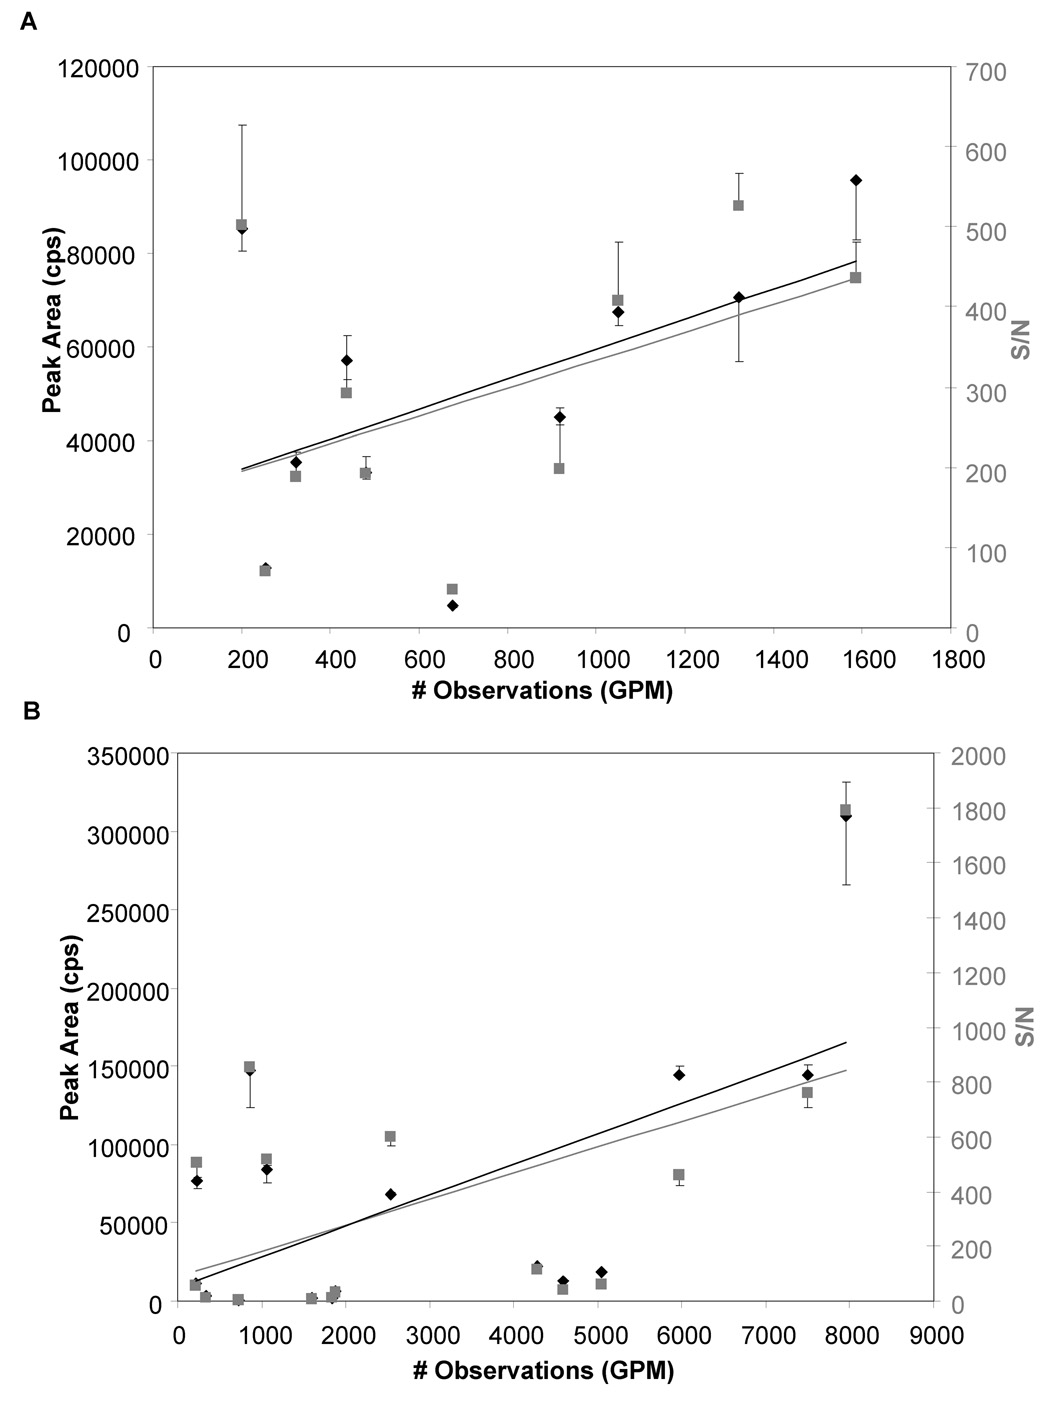
Figure 3. Peptide selection criteria affecting the usefulness of the number of observations in the GPMDB as an estimate of peptide abundance.
Scatter plots showing the number of peptide observations cited in the GPMDB vs the experimentally observed peak area (cps, left axis, black diamonds) and signal to noise ratio of the peaks (S/N, right axis, grey squares). Data shown is from GPM-predicted MRM transitions from 10 peptides from A. Vinculin (swissprot accession number P18206) and 16 peptides from B. Filamin A (swissprot accession number P21333), chosen as they had only been observed as doubly-charged species with no modifications in the GPMDB. While not all peptides followed the trend, in general an increased number of observations in the GPM correlated with higher peak areas and signal-to-noise ratios. Data is the mean of 3 replicate experiments + or − SD

