
Figure 2.
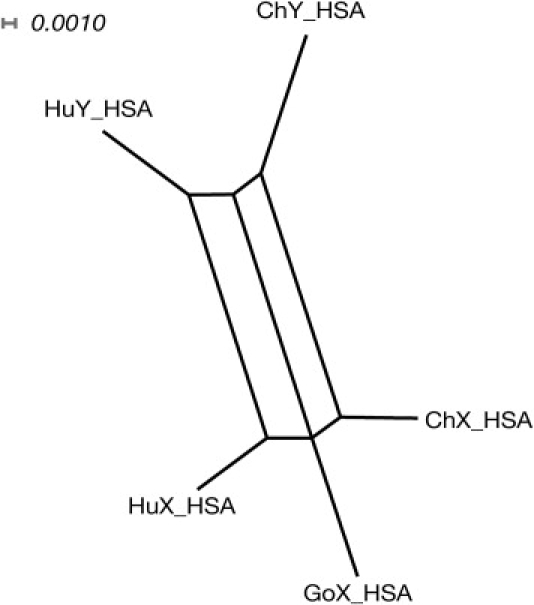
Phylogenetic Network of HSA Sequences in Humans and Great Apes
Phylogenetic split network (based on alignment shown in Figure S2) showing the relationships between HSA segments, produced with SplitsTree422 via the “NeighborNet” method and the “uncorrectedP” distance. Lengths of edges represent the proportion of sites at which sequences differ, as indicated by the scale-bar. The reticulated structure indicates a history of gene conversion. Abbreviations are as follows: Hu, human; Ch, chimpanzee; and Go, gorilla.