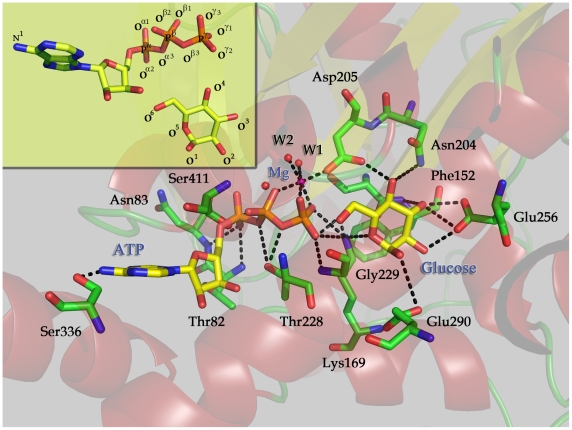
Figure 2. A close view of the configuration of glucose phosphorylation in the environment of GK active site.
The structural model was constructed based on the snapshot at 2500 ps isolated from the 10-ns MD trajectory. W1 and W2 represent water molecules. ATP, Mg2+, glucose and important residues in GK are displayed in stick and labeled. Black dashed lines represent hydrogen bonds or salt bridges. Atomic numbering of ATP and glucose is displayed in the up-left panel.

