
Figure 2.
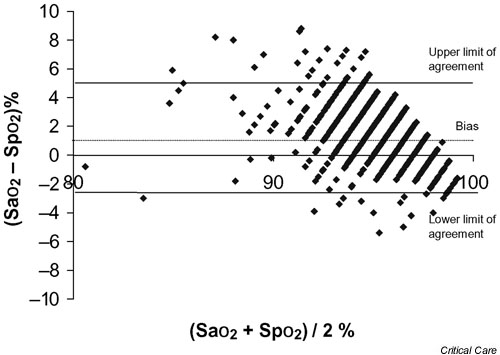
Bland and Altman plot for bias and limits of agreement for total data. SaO2, arterial oxygen saturation; SpO2, pulse oximeter oxygen saturation.
Official websites use .gov
A
.gov website belongs to an official
government organization in the United States.
Secure .gov websites use HTTPS
A lock (
) or https:// means you've safely
connected to the .gov website. Share sensitive
information only on official, secure websites.
Bland and Altman plot for bias and limits of agreement for total data. SaO2, arterial oxygen saturation; SpO2, pulse oximeter oxygen saturation.