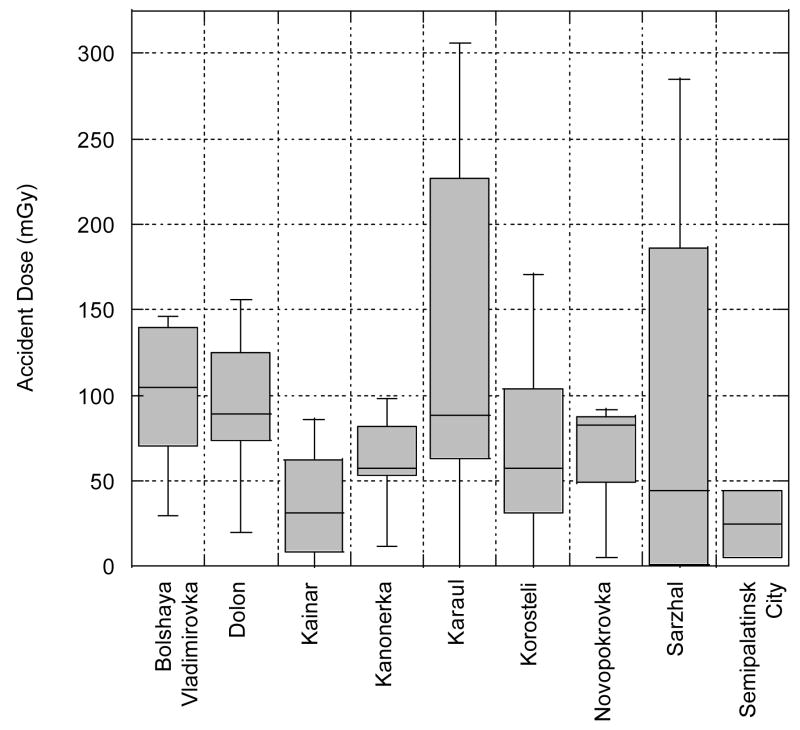
Figure 2.
Box plot of accident dose (mGy) in lateral teeth from persons living in nine villages near to the Semipalatinsk nuclear test site. Note that five outlier data points are not shown, four that are considered as plausible accident doses (Dolon: 1800 mGy, Kainar: 350 mGy, Kanonerka: 1275 mGy, Sarzhal: 1050 mGy) and one value (Semipalatinsk City: 8890 mGy) that was likely a result of medical radiotherapy. Each gray bar includes 50% of data, median is shown as a horizontal line within the bar, end caps on vertical lines from each gray box show minimum and maximum values except for outliers.

