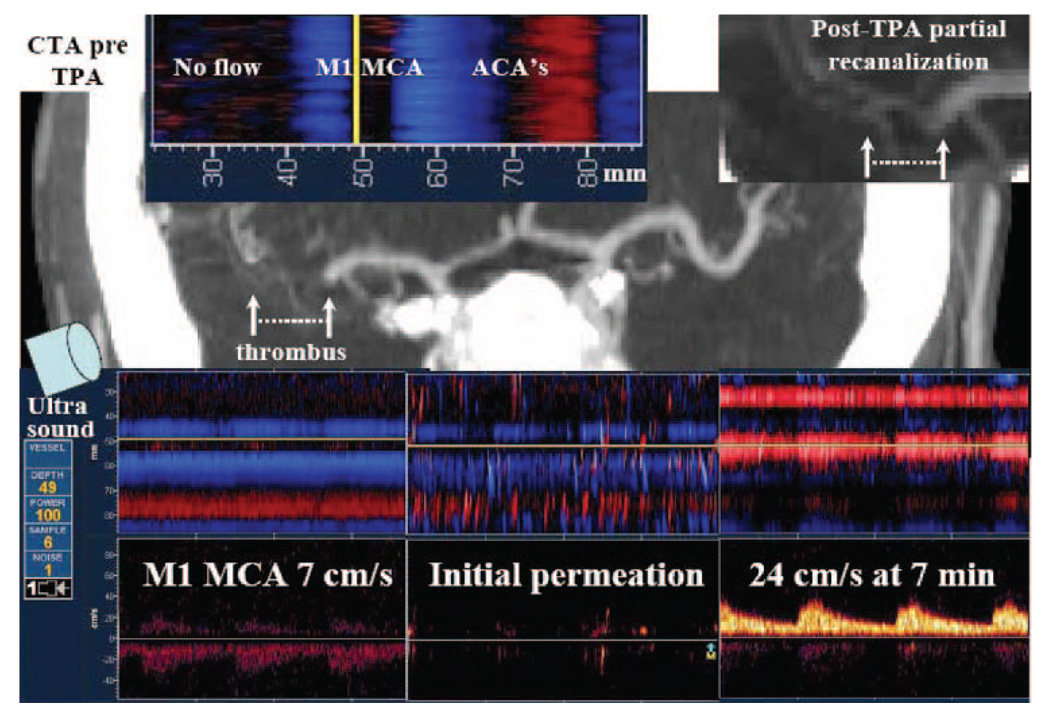
Figure 1.
Power motion Doppler flow tracks of acute MCA occlusion, µS arrival at thrombus location and early residual flow augmentation with partial recanalization. Upper images (left to right), Depth scale (mm) relative to pretreatment CTA showing areas of no detectable flow on PMD relative to thrombus location, and flow signals in opened parts of the MCA and the anterior cerebral artery (left). Posttreatment CTA inset shows partial recanalization (right). Bottom images (left to right), PMD and spectral Doppler recordings showing sluggish residual flow in the affected MCA (7 cm/s) at the time of tPA bolus (left); initial µS arrival at the thrombus and permeation beyond occlusion to areas with no detectable flow at 20 to 30 seconds from start of µS infusion (middle); and partial recanalization with velocity improvement 24 cm/s at 7 minutes after combined treatment initiation (right). Flow toward the probe is coded as red, whereas flow away from the probe is coded as blue. The blue band at a depth of 40 to 50 mm corresponds to MCA collateral retrograde flow. NIHSS score was 12 points pretreatment, 5 points at 2 hours, and 1 point at 24 hours.

