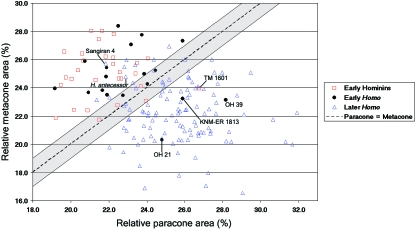
Fig. 2.
Bivariate plot of the relative paracone area vs. the relative metacone area across the hominin sample. Specimens that fall within the shaded area between the solid lines are considered to show equal-sized cusps (see Methods). Specimens attributed to Australopithecus, Paranthropus and early Homo largely fall above the region of equal-sized cusps, indicating they combine a large relative metacone with a small relative paracone. In contrast, most later Homo taxa fall below this same region, indicating the opposite relationship. The positions of a few specimens which depart from this general pattern are indicated.

