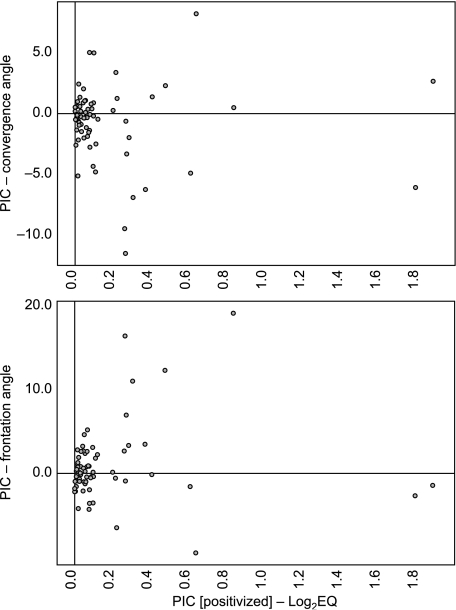
Fig. 3.
Biplots of phylogenetically independent contrasts (PICs) for all taxa in the Carnivora. The PIC values for log2EQ have been ‘positivized’ along the x-axis (see Garland et al. 1992, 1997; Garland & Ives, 2000). PICs for orientation angles (convergence angle, top; frontation angle, bottom) are given on the y-axes. There is no systematic pattern across the Carnivora between either of the two orientation angles and relative brain volume. Rather, all significant correlations that we observe are restricted to the families Canidae and Felidae.

