Fig. 1.
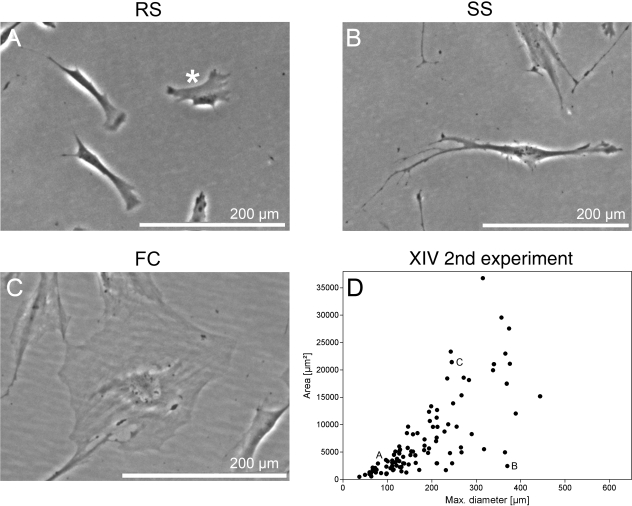
Exemplary cell culture appearance of the three main hMSC subpopulations. Phase-contrast images of hMSC culture containing three distinct subpopulations: (A) small, triangular or star-shaped RS cells with accentuated membrane regions; (B) elongated, fibroblastic-like, spindle-shaped cells, indicated SS cells; (C) large, flattened cells with prominent nucleus, named FC. (D) Dot plot graph presents morphometric results as maximum cell diameter vs. area exemplarily for one donor at one experiment. The cells of A–C represent the labelled dots shown on the graph.

