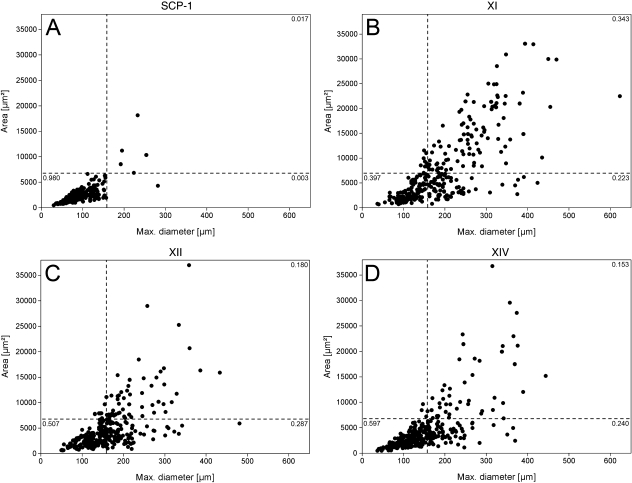
Fig. 2.
Morphological analysis of primary hMSC and SCP-1 cell line. Dot plot graphs represent maximum cell diameter and area. (A) The SCP-1 cluster was based to set the gates between RS, SS and FC cells. Accordingly, RS cells were defined as < 157 µm and < 6617 µm2. SS cells excelled RS cells in maximum diameter, whereas FC were greater than both, with an area > 6617 µm2 and a maximum diameter > 157 µm. With respect to SCP-1 cells, 98% fulfilled RS cell criteria, whereas the donor-derived cells varied in their distribution pattern. (B) Donor XI revealed the lowest fraction of RS cells and the highest amount of FC. (D) In contrast, donor XIV featured the highest percentage of RS cells and the lowest fraction of FC.

