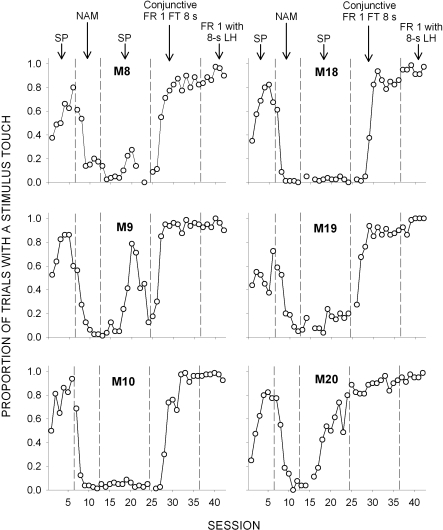
Fig 3.
Proportion of stimulus presentations during which at least one stimulus touch occurred in Experiment 2 plotted as a function of session and conditions. Vertical dashed lines denote condition changes from stimulus pairing (SP), negative automaintanence (NAM), conjunctive Fixed-Ratio 1 Fixed-Time 8 s, and Fixed Ratio 1 with an 8-s limited hold.

