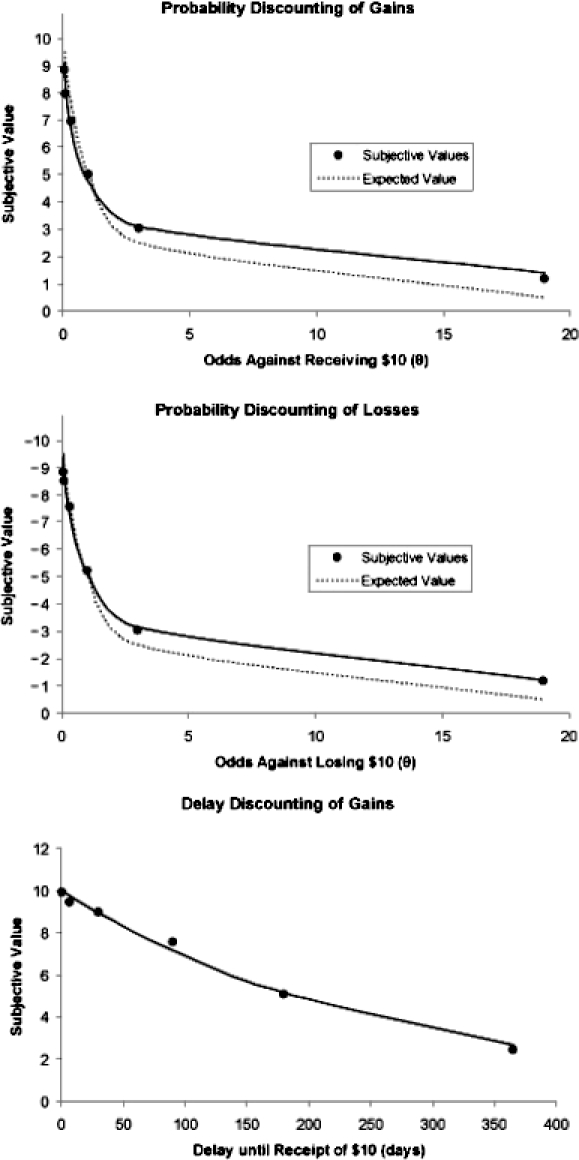
Fig 2.

Group discounting functions for the three discounting tasks. Data points represent the group median indifference points. For probabilistic gains (top panel), the solid line represents the best-fitting hyperboloid discounting function, where h = 4.45, s = .44, R2 = .990; the broken line represents the expected value. For probabilistic losses (middle panel), the solid line represents the best-fitting curve for the hyperboloid discounting function, where h = 2.36, s = .55, R2 = .990; the broken line represents the expected value. For delayed gains (bottom panel), the solid line represents the best-fitting hyperboloid discounting function, where k = .00014, s = 27.20, R2 = .993.
