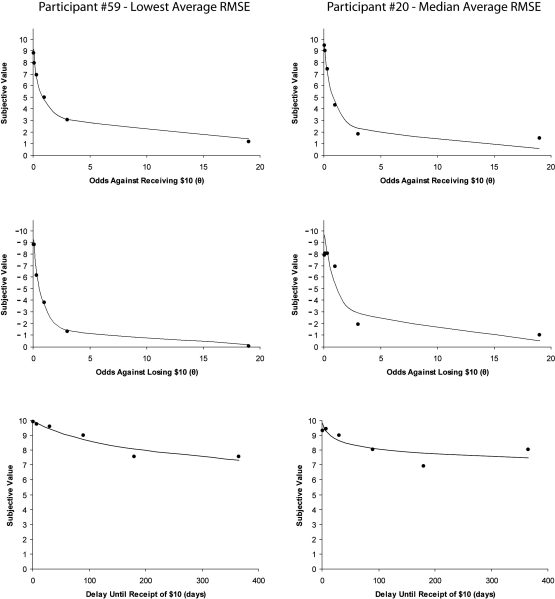
Fig 3.
Individual discounting functions for participants whose average RMSEs across the three discounting tasks correspond to the lowest average RMSE (left panels), and the median average RMSE (right panels). In each instance, the top graph represents the individual participant's subjective values and best-fitting curve for probabilistic gains, the middle graph represents probabilistic losses, and the bottom graph represents delayed gains.

