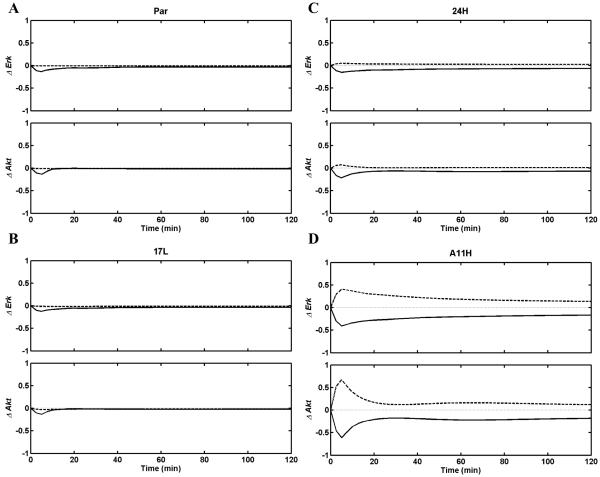
Figure 4.
The change in Erk (ΔErk; top) and Akt (ΔAkt; bottom) activation when the EGFR expression level is reduced by 10% (solid) or the HER2 expression level is reduced by 10% (dashed) in each of the studied cell lines. Cell lines for the panels are as in Fig. 1. Note that panel D has different y-scales compared to panels A-C.

