Figure 1.
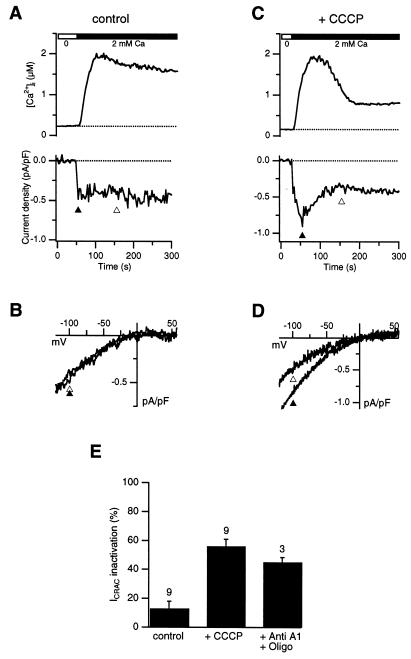
Inhibition of mitochondrial Ca2+ uptake evokes CRAC channel inactivation. ICRAC and [Ca2+]i were measured in parallel using the perforated patch-clamp technique in the absence (A, B) or presence (C, D) of 1 μM CCCP (present throughout the experiments). After irreversible store depletion by TG in 0-Ca2+ Ringer's solution (see Materials and Methods), 2 mM Ca2+ was added to measure ICRAC. A voltage step to −120 mV followed by a voltage ramp from −120 mV to + 60 mV was applied every 2 s from the holding potential (−40 mV). Current density at −100 mV is plotted in A and C (Lower), and leak-corrected ramp currents collected at the times indicated by the triangles are shown in B and D. (E) ICRAC inactivation is plotted as the current measured 100 s after the peak (open triangles in A and C) relative to the peak current amplitude (solid triangles in A and C). 1 μM CCCP or 2 μM antimycin A1 + 1 μM oligomycin increase ICRAC inactivation significantly relative to control (unpaired Student's t test, P < 0.007). The number of cells for each condition is indicated.

