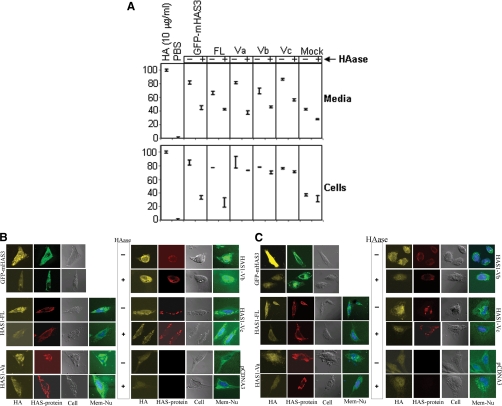
FIGURE 4.
Localization of de novo HA produced by each of the transfected cDNAs. A, competitive enzyme-linked immunosorbent assay-like analysis with bHABP. Top, HA extracted from supernatant harvested from a 6-h incubation of indicated HEK293 transfected cells were treated with (+) or without (−) HAase. 10 μg/ml HA and PBS were used as saturating (100) and zero concentration (0) against limited bHABP used, where free bHABP competes for coated HA on the plate. Bottom, live transfected HEK293 cells with the indicated plasmids were incubated in medium with (+) or without (−) HAase to remove cell surface-bound HA molecules followed by extraction of HA. HAase treatment for 1 h resulted in lysis of at least 8% cells, as determined by microscopic observations, which may reflect a diminished signal. This assay is a qualitative indicator for the presence of HA; it is not quantitative for the full range of HA concentrations. All of the samples were tested in triplicates, and S.E. values are indicated. B, fluorescence microscopy for HA staining. HeLa cells were transfected with the indicated plasmids (marked on the left and right side of the respective panels), fixed, and treated with (+) or without (−) HAase to remove cell surface-bound HA molecules (as marked in the space between the two panels) before permeabilizing and staining. Photographs presenting HA staining by bHABP, N-terminal tag immunostaining, phase-contrast, and membrane/nucleus staining (HA, HAS-protein, Cell, and Mem + Nu, respectively) are indicated at the bottom of each column of photographs. Staining for GFP-mHAS3 appears as green, whereas for other plasmids, membrane and nucleus staining appear as green and blue, respectively. C, similar HA staining was performed as above (B), except in this case, transfected cells were fixed and permeabilized first before treatment with (+) or without (−) HAase to remove both cell surface-bound and intracellular HA molecules.

