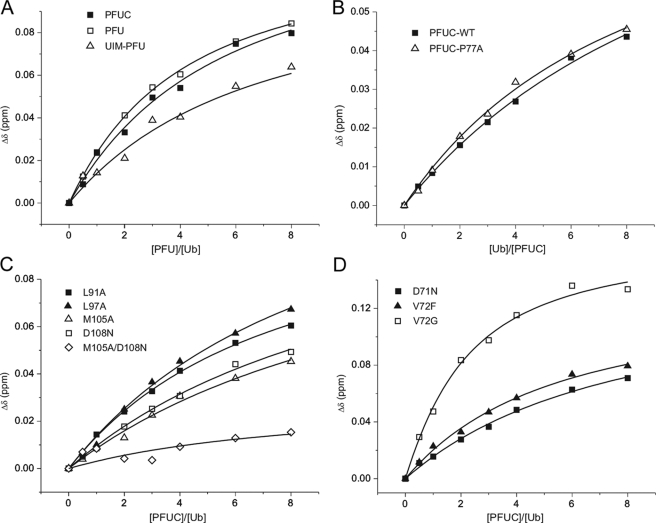
FIGURE 6.
Quantitative analysis of the Ub binding affinities of PFUC and its mutants. A, titration of 15N-labeled Ub with three PFU fragments, PFUC, PFU, and UIM-PFU. B, titration of 15N-labeled wild-type and P77A mutant of PFUC with unlabeled Ub. C, titration of 15N-labeled Ub with unlabeled PFUC mutants in α1-helix (L91A and L97A) and in α2-helix (M105A, D108N, and M105A/D108N). D, titration of 15N-labeled Ub with unlabeled PFUC mutants in the P77 loop region (D71N, V72F, and V72G). The average chemical shift changes of Leu71 in Ub are shown in A, C, and D, and those of Ala111 in PFUC or the P77A mutant are shown in B.

