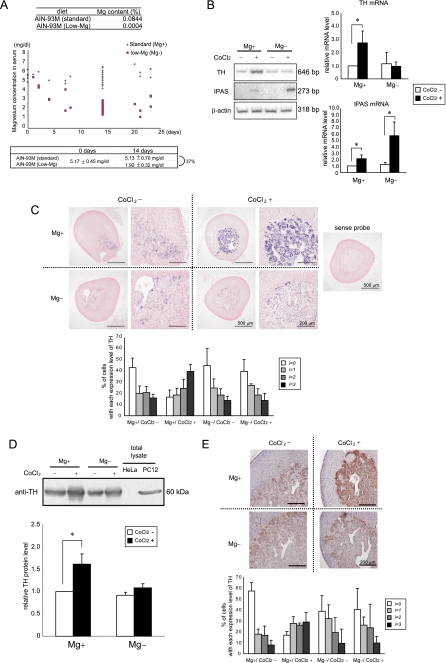
FIGURE 4.
Hypomagnesemia suppresses response to CoCl2 in the AM. A, change in the serum magnesium level of mice fed on a normal or magnesium-deficient diet. The average serum magnesium concentrations at 0 and 14 days in magnesium-deficient and normal mice are shown below. B, TH and IPAS gene expression in the adrenal gland of magnesium-deficient mice induced by CoCl2 injection. The mice were dissected at 6 h after CoCl2 administration. The relative levels of mRNA in the adrenal gland were determined by RT-PCR analysis and normalized to β-actin mRNA. C, in situ hybridization analysis of TH expression (blue) in the adrenal gland of CoCl2-injected magnesium-deficient mice. The sections were counterstained with the nuclear dye, kernechtrot (red). Higher magnification images are also shown. The cells were divided into four groups (i = 0–3) in terms of TH mRNA levels, negative or very weak (i = 0), weak (i = 1), intermediate (i = 2), and strong (i = 3), and cells with respective expression levels were scored. D, immunoblot analysis for TH expression in the adrenal gland of CoCl2-injected magnesium-deficient mice. The mice were dissected at 24 h after CoCl2 administration. Cell extracts of HeLa and PC12 cells were used as negative and positive controls, respectively. Quantified results by densitometry are also shown. E, immunohistological analysis of TH protein (brown) in the adrenal gland of CoCl2-injected mice. The sections were counterstained with the nuclear dye, hematoxylin (dark blue). The cells were divided into four groups and scored as shown in C. *, p < 0.05 for indicated comparison. The data shown in the bar graphs are the averages ± S.D. of three independent experiments.

