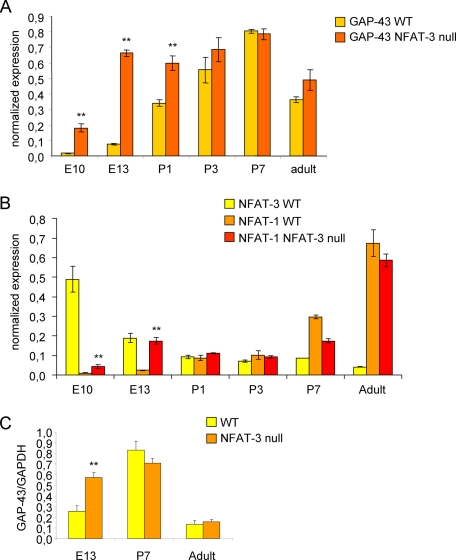
FIGURE 4.
NFAT-3 represses GAP-43 expression during embryonic mouse brain development. A, GAP-43 is higher in NFAT-3 null brains during embryonic development. Quantitative PCR was performed for GAP-43 mRNA levels in NFAT-3 null and wild-type (WT) mice from E10, E13, P1, P3, P7, and adult brains. Total RNA was reverse-transcribed, and target mRNA was quantified. GAP-43 levels are normalized to β-actin mRNA levels. (Under “Experimental Procedures,” see Equations 1 and 2 for the formula to determine β-actin normalized expression levels.) B, NFAT-3 decreases significantly from embryonic to postnatal stages, whereas NFAT-1 increases. Quantitative PCR was performed for NFAT-3 and NFAT-1 mRNA levels in both NFAT-3 null and wild-type mice. (n = 3, triplicate). Student's t test was performed to compare significant difference between wild-type and null samples at each time point, p value: **, <0.01. Error bars represent S.D. C, GAP-43 protein is higher in E13 NFAT-3 null than wild-type brain. Immunoblot analysis was performed for GAP-43 protein from NFAT-3 null and wild-type mice brains. Lysates made from E13, P7, and adult brains was recovered and analyzed by immunoblot analysis with α-GAP-43 and α-GAPDH antibodies. The intensity of the α-GAP-43 immunoblot signal was quantified and normalized to α-GAPDH signal to calculate the -fold difference of GAP-43 protein levels between NFAT-3 null and wild-type brains. (n = 3, triplicate). Student's t test p value: **, <0.01. Error bars represent S.D.

