
Figure 2.
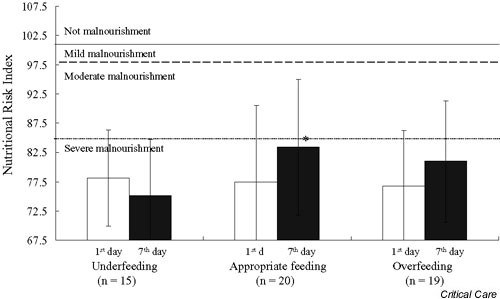
The Nutritional Risk Index at day 1 (white bar) and at day 7 (black bar) after admission to the intensive care unit for patients in the underfeeding, appropriate feeding, and overfeeding groups. * The value at day 7 is significantly different to that at day 1, P < 0.05.