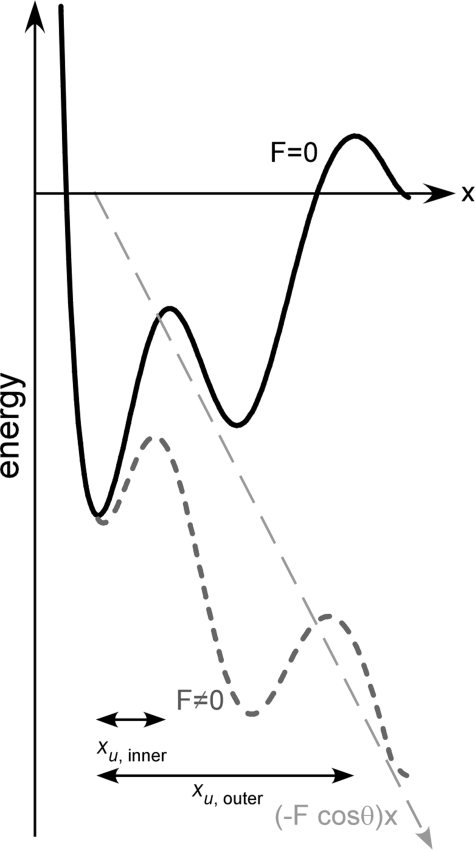
FIGURE 2.
Energy landscape tilted by force. Schematic representation of the free energy profile along the reaction coordinate and applied force according to the Bell-Evans theory (40–42). The potential along the reaction coordinate (vector of force) in the absence of force (black curve) exhibits two energy barriers separating the folded from the unfolded state. Application of an external force, F, changes the thermal likelihood of reaching the top of the energy barrier(s). Although for a sharp barrier the position, xu, of the energy barrier relative to the folded state is not changed, the thermally averaged projection of the energy profile along the pulling direction is tilted by the mechanical energy (−F·cos θ)x (long-dashed line). This tilt decreases the energy barriers (short-dashed curve). Consequently the relevant energy barrier that has to be overcome is the outermost barrier. At slow pulling velocities, the thermal contribution is higher, and therefore, the mechanical energy required to overcome the barrier is smaller. With increasing pulling velocities, the barriers are further lowered. At some velocity, the height of the outer barrier will be lower than that of the inner barrier (short-dashed curve), which then becomes the relevant energy barrier to be overcome. Each energy barrier manifests as a linear regime in dynamic force spectra (Fig. 3).

