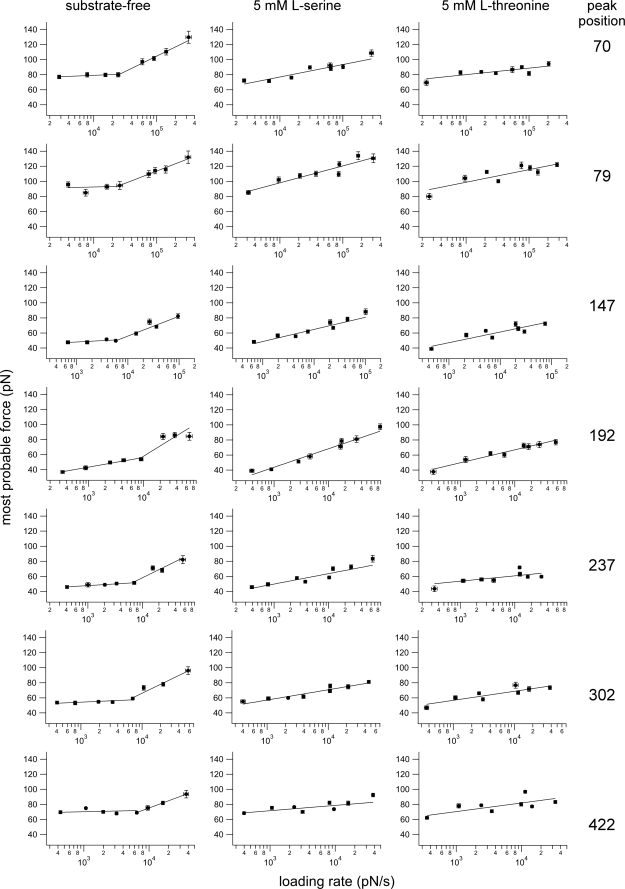
FIGURE 3.
Pulling velocity-dependent response of interactions that stabilize individual segments of SteT. Fitting the rf-dependent F* (lines) using Equation 2 provides the parameters of the energy barrier that stabilizes structural segments within SteT. xu measures the distance from the energy well of the native state to the transition state, and k0 describes the kinetic transition rate at which the structural segment unfolds at zero force. Error bars represent the S.E. of force and loading rate, respectively. Fits were weighted using the S.E. of the most probable force. Experiments were performed in 150 mm NaCl, 20 mm Tris-HCl, pH 8.0 in the absence of substrates (left column) or in the presence of 5 mm l-serine (middle column) or 5 mm l-threonine (right column). Peak positions are in amino acids.

