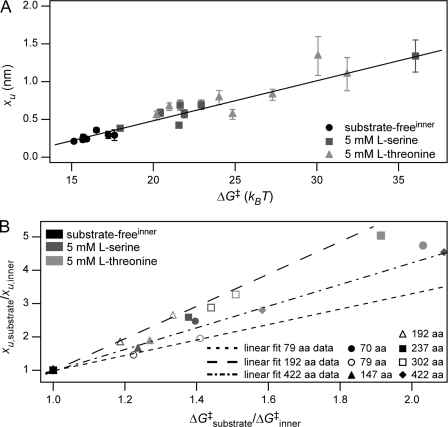
FIGURE 4.
Correlation between xu and ΔG‡. A, plotting xu versus ΔG‡ reveals their linear correlation for all structural segments of substrate-free SteT (inner barrier; black symbols) and SteT in the presence of 5 mm l-serine (dark gray symbols) or 5 mm l-threonine (light gray symbols). Error bars represent S.D. B, changes in xu and ΔG‡ for SteT in the absence (inner barrier; black symbols) and presence of l-serine (dark gray symbols) or l-threonine (light gray symbols) with respect to the values for the inner barrier of substrate-free SteT. All structural segments revealed an apparent Hammond behavior; i.e. upon ligand binding xu increased with increasing ΔG‡. Short-dashed, long-dashed, and dot-dashed lines represent linear fits to the values obtained for the structural segments at 79 (open circle), 192 (open triangle), and 422 aa (filled diamond), respectively. The different slopes of these fits (2.31, 4.85, and 3.25 for the short-dashed, long-dashed, and dot-dashed lines) show that ligand binding influenced each individual structural segment differently. Data are taken from Table 3.

