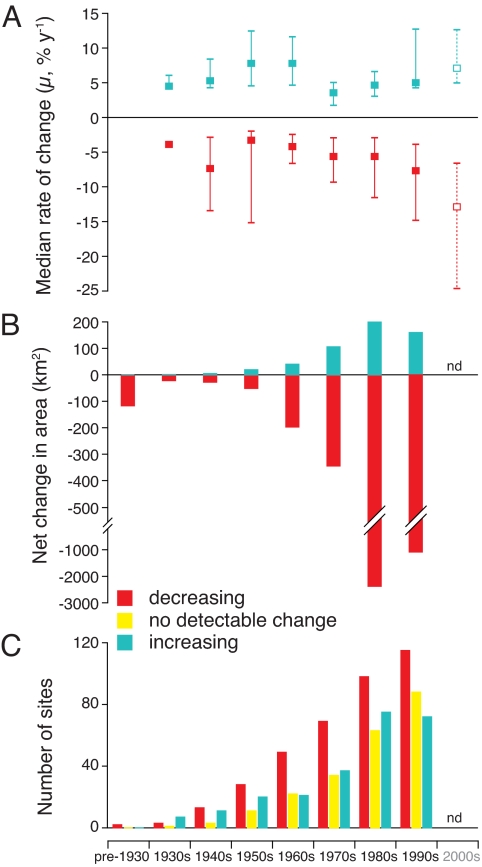
Fig. 1.
Decadal trends in seagrass areal extent. Sites were categorized as declining in area, as increasing in area, or as having no detectable change (i.e., ±10% of initial area). Values for the 2000s (dotted line) include 2000–2006 data only. nd, not determined because of incomplete data. (A) Median % rate of change (μ) by decade across sites. Error bars represent 25% and 75% quartiles. (B) Measured net change in seagrass area, calculated as the net change across each decade. (C) Number of sites in each category (decreasing, increasing, or no change) by decade.

