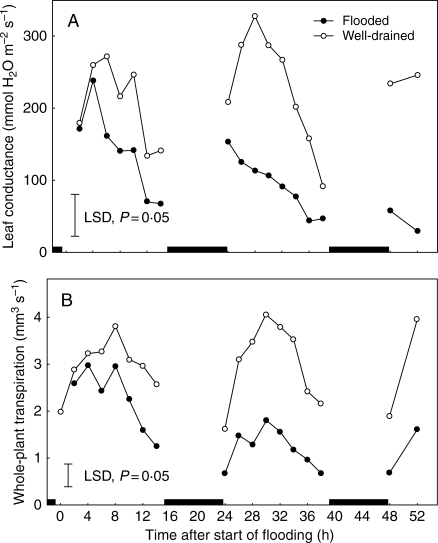
Fig. 2.
The effect of soil flooding for up to 52 h on (A) leaf conductance of the fifth oldest leaf and (B) whole-plant transpiration rates in 1-month-old tomato plants. Each point represents the mean of eight replicates. Vertical lines are LSDs at P = 0·05. Black boxes on the x-axis indicate dark periods.

