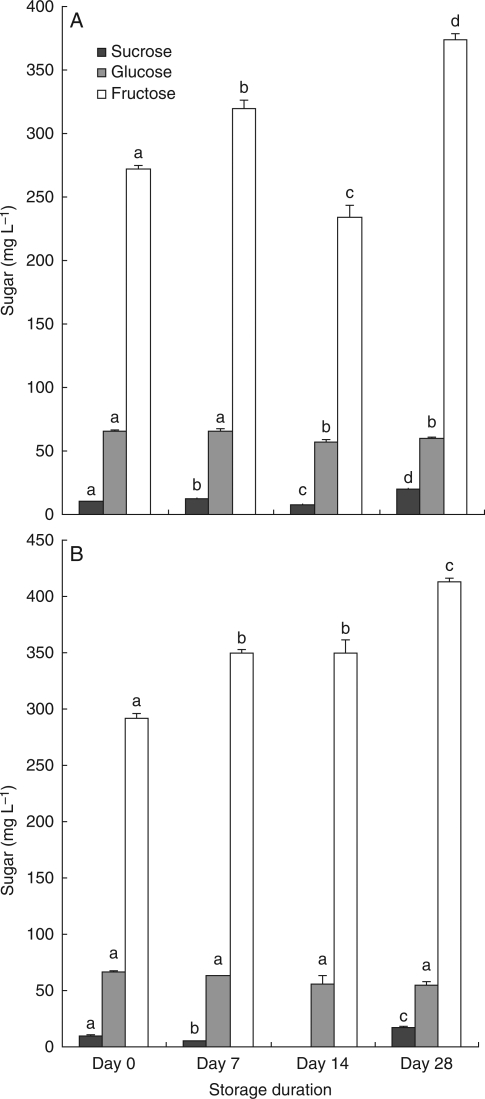
Fig. 5.
Mean concentration (mg L−1) of sucrose, glucose and fructose in wash solutions from flowers of E. sargentii ssp. fallens for two storage conditions over a 28-d period. Error bars show s.e. (standard errors for sucrose were generally too small to be visible at this scale). Sugar in mg is expressed on a logarithmic scale. (A) Freezer, (B) refrigerator with methanol. Different letters indicate statistically significant differences between times of storage for each sugar considered separately. Note that no data were recorded for sucrose in the refrigerator with methanol treatment on day 14.

