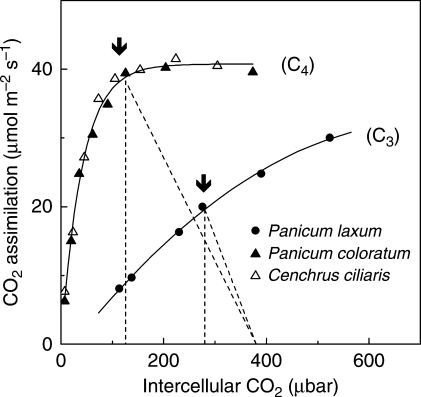
Fig. 2.
The response of CO2 assimilation rates (A) to intercellular CO2 concentration (Ci) in one C3 (Panicum laxum) and two C4 (Cenchrus ciliaris and Panicum coloratum) grasses. Gas exchange measurements were made at 30 °C and 1200 µmol quanta m–2 s–1. The dotted lines represent the slope of stomatal conductance, g = A/(Ca – Ci), where Ca and Ci are the ambient and intercellular [CO2], respectively. The arrows indicate A at the operational Ci (i.e. Ci at normal air [CO2]; O. Ghannoum, unpubl. res.).

