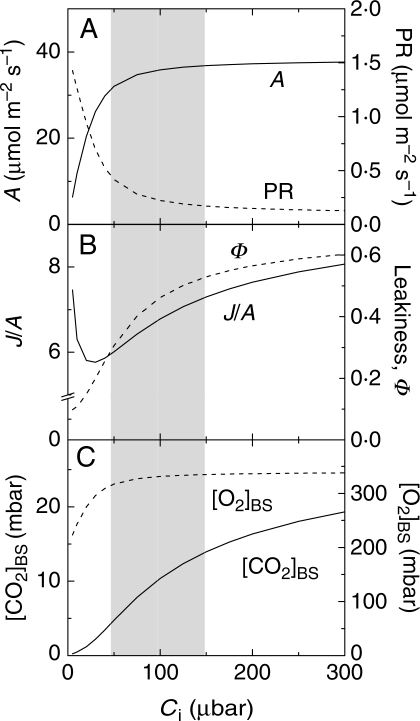
Fig. 4.
Modelling the response of C4 photosynthesis to intercellular [CO2], Ci, using the C4 photosynthesis model developed by von Caemmerer (2000). (A) CO2 assimilation rates (A, continuous line) and photorespiration (PR, dotted line); (B) the ratio of the rates of electron transport to CO2 assimilation (J/A, continuous line) and leakiness (Φ, dotted line); and (C) bundle sheath [CO2] ([CO2]BS, continuous line) and [O2] ([O2]BS, dotted line). The modelling simulates a mature C4 leaf with maximal PEPC and Rubisco activities of 120 and 40 µmol m–2 s–1, respectively; a bundle sheath conductance to CO2 per leaf area of 3 mmol m–2 s–1. Other parameters are similar to those described in table 2 of von Caemmerer and Furbank (1999). The shaded area represents the likely range of Ci experienced by well-watered and mildly water-stressed C4 leaves.

