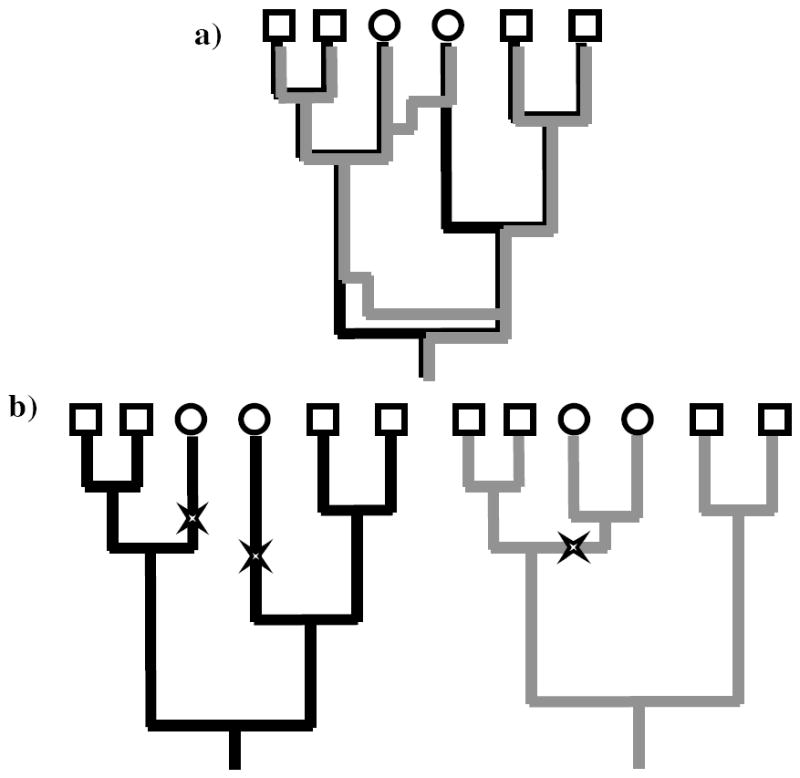
Figure 1.

In a), we see a simple recombinant coalescent tree (ancestral recombination graph) with the black history separated from the grey history by two recombination events. In b), these have been separated into two ‘interval trees’. The observed data (squares and circles) are more likely to be observed on the right (grey) tree than the left (black) tree, since only one mutation event is needed to explain the data, not two.
