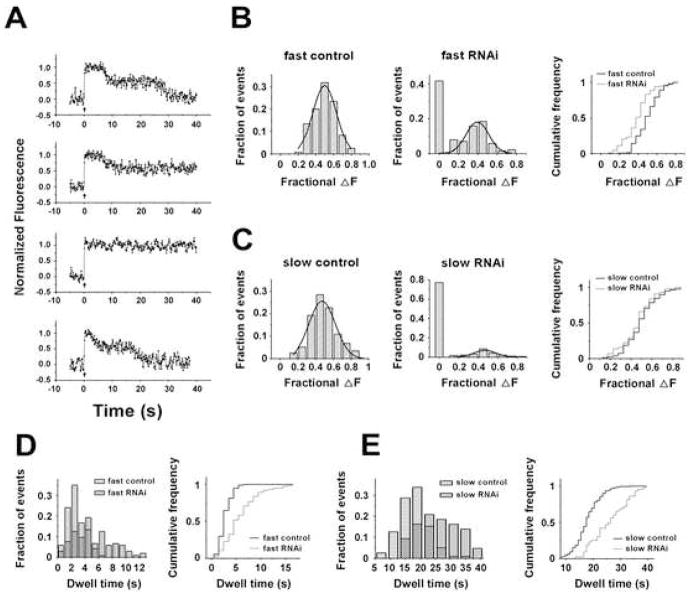
Figure 6. Clathrin Knockdown by RNAi Inhibits Both Endocytosis.
(A) Example traces of single vesicle response with clathrin RNAi knockdown (upper 3 panels), and control (the bottom panel). The responses with clathrin RNAi knockdown can be classified into three groups. (i). Both the fast and slow endocytosis were detectable (accounting for ~20% of the total recordings), as shown in the top panel; (ii). Only the fast endocytosis was detected (~38% of the total recordings), as shown in the second panel; (iii). Neither fast nor slow endocytosis was detected (~42% of the total recordings), as shown in the third panel. Bottom panel presents an example trace of single vesicle response from a neuron transfected with scrambled RNAi (control).
(B and C) Clathrin RNAi knockdown inhibits both the fast (B) and slow (C) endocytosis. Frequency distribution of fractional fluorescence decrease during each endocytosis in control neurons (n=120 traces) is shown in the left panels, and in RNAi knockdown neurons (n =192 traces) is shown in the middle panels. The traces without detectable endocytosis were grouped as a bar at 0. The detectable endocytosis events were further fitted with Gaussian distribution (smooth curves). Right panels are cumulative histograms for events in control neurons and detectable events in RNAi knockdown neurons. Gaussian fits of the fast endocytosis in (B) yielded an estimation of 0.50 ± 0.11 (mean ± SD, n = 192 traces) for control and 0.40 ± 0.12 (mean ± SD, n = 104 traces) for the detectable events in CHC-RNAi knockdown. Two populations are significantly different, ***p < 0.001, t test. Gaussian fits of the slow endocytosis in (C) yielded estimations of 0.47 ± 0.14 (mean ± SD, n = 192 traces) for control and 0.47 ± 0.11 (mean ± SD, n = 43 traces) for the detectable events in RNAi knockdown. No significant difference was observed, p > 0.05, t test.
(D and E) Clathrin knockdown delays both endocytosis. Left panels in (D) and (E) present frequency dwell time distributions of the fast (D) and slow (E) endocytosis detected in RNAi knockdown neurons (filled gray bar, n = 104 traces for the fast endocytosis, n = 43 traces for the slow endocytosis) and control neurons (striped bar, n = 120 for both endocytosis). Right panels are the cumulative dwell time distributions of the fast (D) and slow (E) endocytosis. For both endocytosis, clathrin knockdown significantly prolonged the dwell time (see text), ***p < 0.001, t test compared to control.

