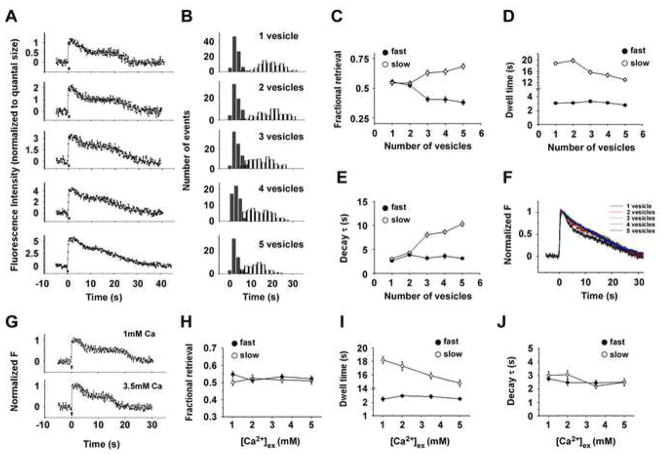
Figure 8. Increased Activity Selectively Accelerates the Slow Endocytosis, but Not the Fast Endocytosis.
(A) Example traces of fluorescence intensity as a function of time following 1, 2, 3, 4, and 5 vesicle fusion events. Action Potentials (1Hz, 5Hz, 10Hz, 20Hz and 30Hz with duration of 0.5s) were delivered at 0s, as indicated by the bars.
(B) Comparisons of the dwell time distributions of endocytosis after different number of exocytosis events. Each histogram shows the dwell time distribution of the fast (filled bar) and slow (open bar) endocytosis after the release of one vesicle (n=86), two vesicles (n=64), three vesicles (n=64), four vesicles (n=51) and five vesicles (n=51). Further kinetic analyses of these traces are presented in C–F.
(C) Fractional retrieval of SypHluorins by the fast (filled circle) and slow (open circle) endocytosis as a function of the number of exocytosed vesicles. With the increased number of exocytosed vesicles, a larger fraction of SypHluorins was retrieved by the slow endocytosis.
(D) Averaged dwell time of the fast (filled circle) and slow (open circle) endocytosis as a function of the number of exocytosed vesicles. Increasing vesicle number shortened the dwell time of the slow endocytosis, but had no significant effect on the fast endocytosis.
(E) Averaged decay time constant of the fast (filled circle) and slow (open circle) endocytosis as a function of the number of exocytosed vesicles. Increasing vesicle number prolonged the decay time constant of the slow endocytosis, but not the fast endocytosis.
(F) Normalized average traces of fluorescence responses after multiple vesicle fusions. Single exponential fit provided a relatively good account of the fluorescence decay except for one vesicle, yielding time constant (τ) of 19.6 ± 0.7 s, 17.7 ± 1.4 s, 16.3 ± 0.9 s, 15.6 ± 1.0s and 14.4 ± 0.7 s for 1, 2, 3, 4, and 5 vesicles, respectively. No significant differences were observed between 2–5 vesicles (Turkey’s multiple comparison test, p>0.05)
(G) Example traces of fluorescence intensity as a function of time for single vesicle fusion in 1mM and 3.5mM external calcium. Action Potential was delivered at 0s, as indicated by the arrow.
(H) Fractional retrieval of SypHluorins by the fast (filled circle) and slow (open circle) endocytosis as a function of [Ca2+] ex, after single vesicle fusion. The number of single vesicle fusion events for different [Ca2+] ex are: n = 49 for 1mM, n = 44 for 2mM, n = 51 for 3.5mM, and n = 43 for 5mM. No significant differences were observed for both the fast and slow endocytosis, with [Ca2+] ex increased from 1mM to 5mM (Turkey’s multiple comparison test, p>0.05). Further kinetic analyses of these traces are presented in I and J.
(I) Averaged dwell time of the fast (filled circle) and slow (open circle) endocytosis as a function of [Ca2+] ex, after single vesicle fusion. Increasing [Ca2+] ex shortened the dwell time of the slow endocytosis, but had no effect on the fast endocytosis. (Turkey’s multiple comparison test, at the level of 0.05).
(J) Averaged decay time constant of the fast (filled circle) and slow (open circle) endocytosis as a function of [Ca2+] ex, after single vesicle fusion. No significant differences were observed for 1mM to 5mM for both endocytosis (Turkey’s multiple comparison test, p>0.05).
Error bars represent SEM.

