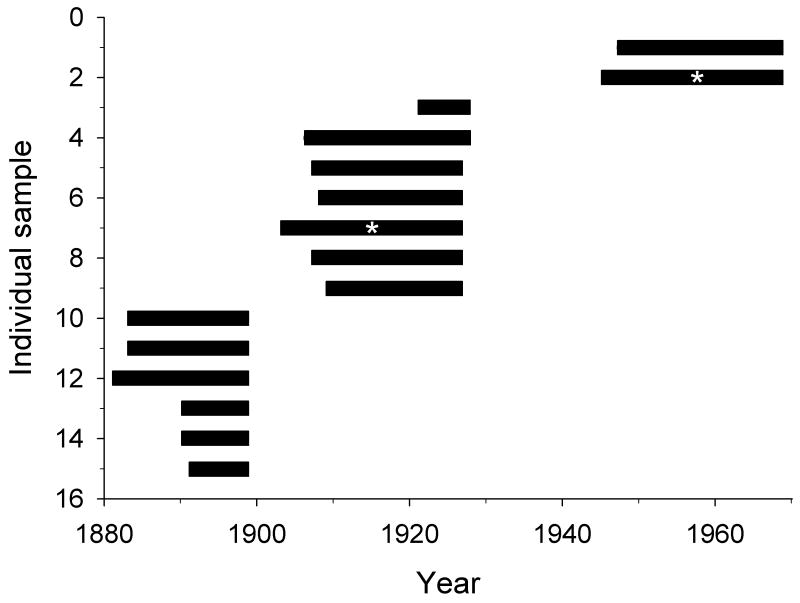
Figure 2.
Schematic showing the timeframe represented by each of the 15 individual S. groenlandicus analyzed for growth patterns. Lifespan was determined from the collection date of the individuals and an analysis of the annual growth increments on the shell. Asterices mark individuals sampled for stable isotope and elemental ratios.

