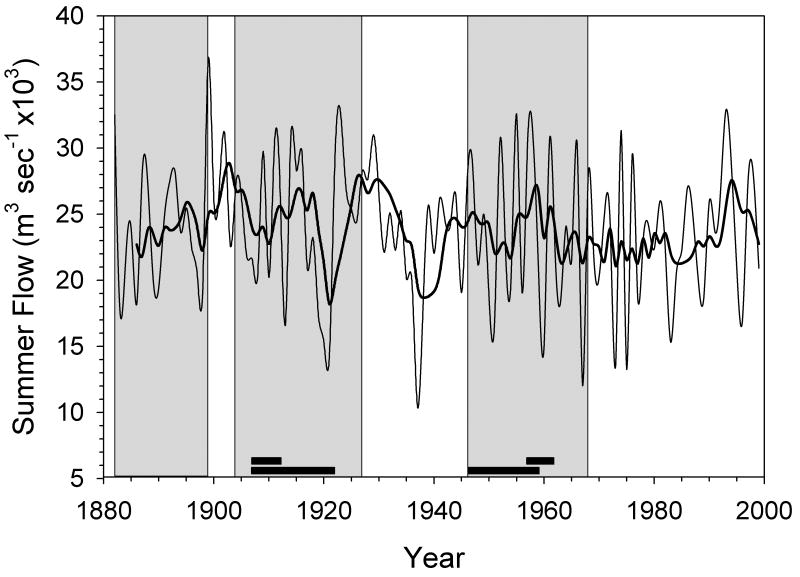
Figure 9.
Summer flow (m3 sec-1 × 10³ for the months of May, June, and July) of the Severnaya Dvina measured at the Ust'-Pinega gauge for the period 1881-1999. Both annual values (thin line) and a 5-year smoothing function (bold line) are shown. Time periods with growth data of S. groenlandicus are highlighted grey, and black bars at the bottom plot denote periods with shell stable isotope (bottom bar) and trace element (top bar) results. Data from Roshydromet (Moscow, Russia).

